
Sales KPIs: What They Are and How to Use Them
In today’s competitive business environment, it’s more important than ever to track the performance of your sales team. Key performance indicators (KPIs) can help you measure how well your sales team is performing, identify areas for improvement, and make data-driven decisions to drive growth.
How important are KPIs for sales?
Most sales leaders and sales organizations have strong KPI system to track main indicators which drives their business and allows them to identify pain points and weak points and improve them, but one of the critical mistakes are when sales leaders forget that KPIs is not for their sales reps, but it is for them to make a right decision before its too late, and ones who forgot that it’s for them, starts to push their team to improve KPIs which at the end of the day ends like improved stats lines but not results.
How AI and ChatGPT can help for sales team with the KPI:
Different times and different situations in the market require different KPIs to track for maximum results, and sometimes we need additional inspiration or ideas on what to track, and how to build the KPI system as its part creative part technical task to do, so here the help we can execute with the help of AI and ChatGPT which with the right prompts can help with the perfect ideas and examples which we can adapt to our sales organizations need. Please find below a few examples provided by ChatGPT in regards of different KPI, to get data we simply used prompts like: “provide top sales KPI”, ” different sales team performance indicators” “what KPI to track to improve sales team” and there is no limitation to ask for different prompts to get maximum interesting results, please find some below:
KPI 1: Sales Performance by Team Member
- Monthly sales revenue per team member
- Average deal size per team member
- Sales conversion rate per team member
- Number of new clients per team member
- Number of meetings booked per team member

This table tracks the sales performance of each team member on a monthly basis. It shows the total sales revenue generated by each team member, the average deal size, the sales conversion rate, the number of new clients acquired, and the number of meetings booked. By tracking these KPIs over time, you can identify the top performers on your team and adjust your sales strategies accordingly.
KPI 2KP: Sales Pipeline
- Number of leads in the sales pipeline
- Average lead response time
- Average time to close a sale
- Average number of touchpoints per sale
- Conversion rates at each stage of the sales pipeline

This table tracks the sales pipeline on a weekly, monthly, and quarterly basis. It shows the number of leads in the pipeline, the average lead response time, the average time to close a sale, the average number of touchpoints per sale, and the conversion rates at each stage of the sales pipeline. By tracking these KPIs, you can identify areas where your team is performing well and areas where they need improvement.
KPI 3: Sales by Product/Service
- Monthly sales revenue by product/service
- Percentage of total sales revenue by product/service
- Average deal size by product/service
- Sales conversion rate by product/service
- Number of new clients by product/service

In the table like above we are tracking sales results and different indicators by different products, it’s very useful to see different metrics from different products and solutions which can allow our technical team, engineering team, and sales team to build future products, improvements, and sales approaches to build more sellable products and solutions and to identify where improvement for the product or sales squad is needed.
KPI 4: Sales Velocity
- Formula: Total amount of closed deals / Number of days in a given period (e.g. week, month, quarter)
- Example: Let’s say your sales team closed 10 deals in a week. Your Sales Velocity KPI for that week would be 10 / 7 = 1.43.

What it indicates: Sales Velocity KPI measures how quickly your sales team is closing deals. A higher Sales Velocity KPI means your team is closing deals faster. Its perfect tool when we have several different teams and individuals working on same product or solution and tracking weekly/monthly/quarterly it allows to identify which team separates from other and use the same tactics to other teams to improve our overall sales.
KPI 5: Lead Response Time
- Formula: Time taken to respond to a lead / Number of leads
- Example: Let’s say your team responded to 50 leads in a week and the average response time was 2 hours. Your Lead Response Time KPI for that week would be 2 / 50 = 0.04 hours.

Lead Response Time KPI measures how quickly your team responds to leads. A lower Lead Response Time KPI means your team is responding faster to leads. Its especially critical to track when we are getting a leads provided by different teams, and the ones who can handle leads and respond faster are more likely to convert leads to deals.
KPI 6: Sales-to-Activity Ratio
- Formula: Total sales / Number of activities performed (e.g. calls made, emails sent, meetings held)
- Example: Let’s say your team made 100 calls in a week and closed 2 deals, with a total revenue of $10,000. Your Sales-to-Activity Ratio KPI for that week would be $10,000 / 100 = $100.
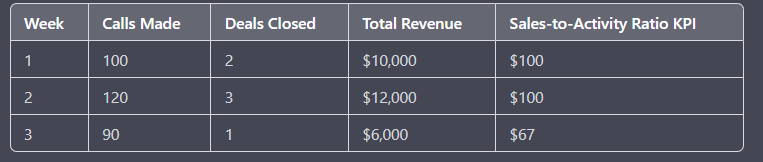
Sales-to-Activity Ratio KPI measures how much revenue your team generates for each activity performed. A higher Sales-to-Activity Ratio KPI means your team is generating more revenue per activity.
All of these KPI tables can be created in an Excel spreadsheet. You can use columns to list the different performance indicators and rows to track the data over time.
In just minutes of our time, we have AI-generated 6 different KPI metrics to track and improve our sales team, and it’s just a surface with tools like ChatGPT we can generate dozens if not hundreds of different sales performance indicators together with formulas that successful can allow for us to build sales KPI tables.
Interesting view to different KPIs systems, we track efforts / time = result